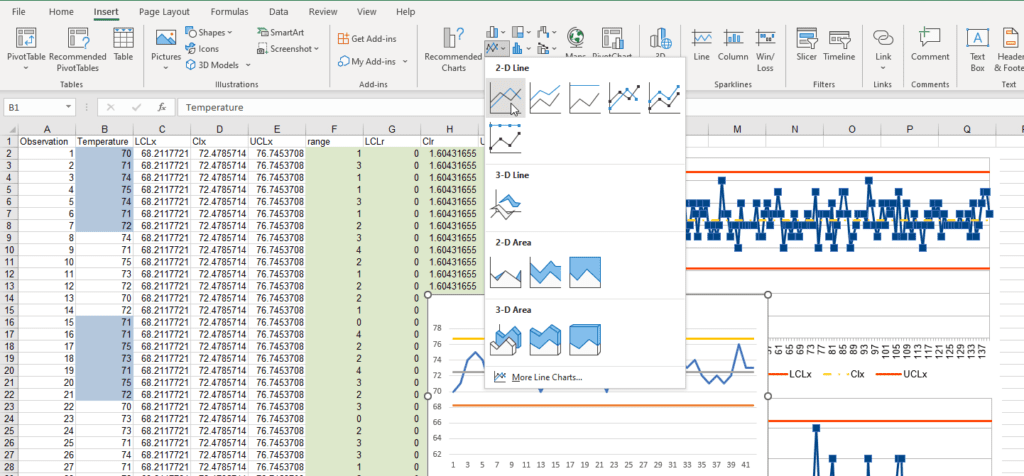
Create control charts in excel
Learn how to create 6 of the most common types of control charts in Microsoft Excel. This article includes a sample file of all the charts and a walk-through for each chart.
Learn how to create 6 of the most common types of control charts in Microsoft Excel. This article includes a sample file of all the charts and a walk-through for each chart.
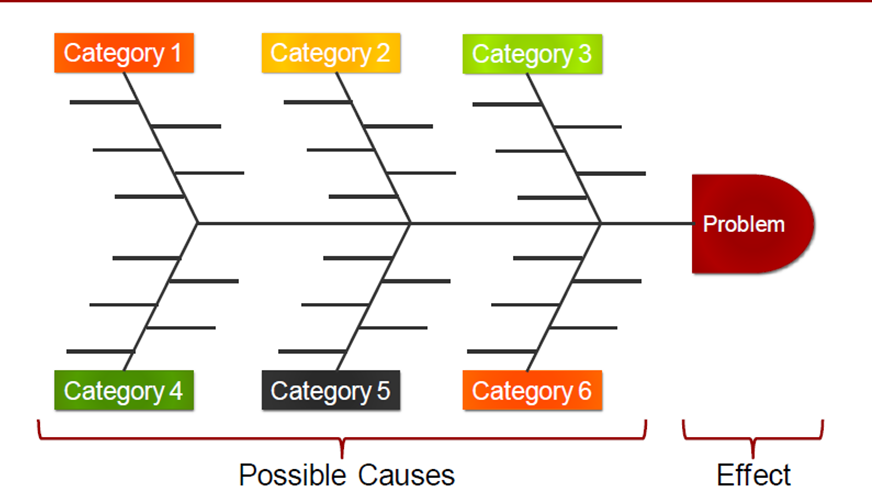
The cause and effect diagram or Fishbone diagram is one of the seven quality tools, to identify the potential causes of problems. Learn more!
Many of us have heard about the term Pareto Analysis or Pareto Chart or 80-20 rule. But, what is the meaning of it? And how to use it in our day to day life? This article explains about the Benefits of Pareto analysis, How to use it with Demonstration and how we can utilise it