The cause and effect diagram or Fishbone diagram is one of the simple and important tools of seven quality tools, which helps to identify the potential causes of specific problems.
Fishbone Diagram is the visualization tool and principal part of Quality tools. It gives privilege to the project teams by visualizing the diagram to identify the root cause of any problem, prioritize them and solve the problems simultaneously.
We will discuss following topics in this article.
- What is another name for a fishbone diagram
- History of fishbone diagram
- How to read a fishbone diagram
- Fishbone Diagram 6m
- How to make a fishbone
- Fishbone diagram example
- Fishbone diagram use
- Fishbone diagram excel
- Downloadable fishbone diagram template
What is another name for a fishbone diagram


See how Factovare helps factories digitize work
Watch the demo and contact us to try Factovare for your manufacturing operations.
Free Training Registration
Factovare Certified Manufacturing Excellence Professional (FCMEP)
Trainer: Founder of Factovare and Know Industrial Engineering
Learn directly from the person behind both platforms.
What you will learn
Enter your details and verify email OTP to reserve your seat.
Step 1: Enter your name and email address, then click Send OTP.
Fishbone Diagram is also known as the following;
- Ishikawa Diagram
- cause and effect diagram
- Herringbone diagrams
- Fishikawa
History of fishbone diagram
Fishbone diagram was invented in the year 1960s by Kaoru Ishikawa, one of the most renowned quality management innovationists. He was born in Japan on July 13th 1915 and was popular for the development of quality initiatives specifically, Quality circle.
How to read a fishbone diagram
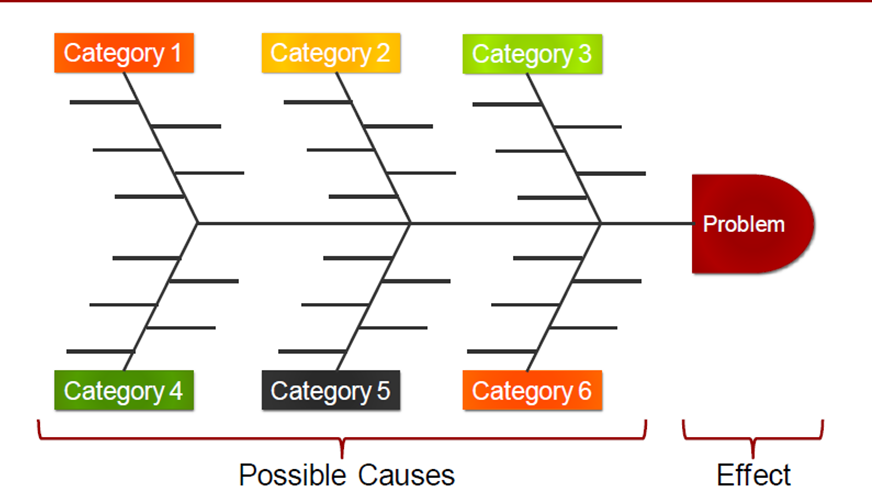
Understanding Fishbone diagram: The diagram is known as fishbone because the shape of the diagram is similar to the skeleton of the fish, with problems or defects shown as the head of the fish on the right side of the diagram written as Effect, while the causes which are effecting the problems are visualized as the ribs of the fish noted as Category 1, category 2, etc. with subcategory in each level.
Fishbone Diagram 6m
Each possible causes is often tracked by using the 6M technique:
- HuMans/Man power
- Machines (Technology, Equipment)
- Materials (raw material, resources, information etc.)
- Methods (process)
- EnvironMent (Purpose, mother nature)
- Measurement system (Inspection)
How to make a fishbone
- Problem statement: Gather the team, draft a transparent and clear problem statement stating about on how and when the problem occurs. All the team members should be on same page and agree upon the problem.
Write down the problem on the right side (Head) of the fishbone diagram as shown in the below figure. Draw the line connecting the head to the backbone of the ribs, which will state the potential causes of the particular problem.
- Categorization: After identifying the problem, start with the brainstorming sessions. Brain storming can be open ended or select the category from 6M and identify possible causes in each category.
If using an open brainstorm, affinity diagram can be used to categorize the causes. It will prioritize the categories by removing the duplicate ideas.
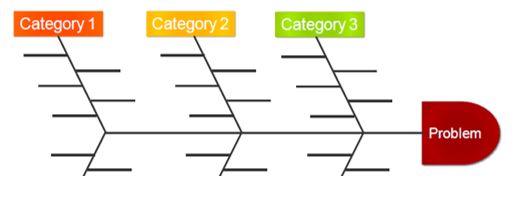
- Contributing factors/Sub-categories: After brainstorming possible causes, attach each causes with the ribs of the fishbone diagram. The diagram will look like a fish bone now after all the categories are identified and attached to the potential problems. In each category, one can find the lines as shown in the figure. Those are contributing factors. Team needs to identify the factors which are contributing the possible causes of that specific problem.
If you have a contributing factor that fits into more than one category, place it in each location, and see whether, in the end, considering that factor from multiple points of view has made a difference.
- Ask: Why (Also known as 5Whys): The simple way to get down to the deeper cause is to ask the question WHY? Team needs to keep asking the “WHY” until you get something that feels like the root cause of the problem. Each WHY may have multiple WHYs which are worth considering. Prioritize the most likely WHYs for further investigation.
- As the diagram gets developed, team needs to focus on the area where the idea are less and needs more focus.
Fishbone diagram example

This is the example of paper printing industry, where around 8% of paper is wasted in the process. By using Fish Bone Diagram the causes of the paper waste will be clearer. The team has considered here various factors due to which the paper is wasted in the process.
Fishbone diagram use
- It helps to recognize the cause and effect relationship between problems and process
- It increases the creative thinking by brain storming sessions
- It opens up new channel and new idea with the collaboration of whole team
- Sub-categories allows to deep dive into the problems
- It helps to prioritize the causes and what needs to address first
Fishbone diagram excel
Downloadable fishbone diagram template
You can download fishbone diagram excel template by clicking the below download button.
How to create a fishbone diagram in excel
Refer the downloadable fishbone diagram template from the above section. And follw the following steps to create a fishbone diagram in excel
- Open an excel file
- Insert ‘Delay’ shape from flow chart section and name it as problem. You can design that shape as you wish.
- Insert ‘Line arrow’ shape and position it to perpendicular to the vertical line of ‘delay shape. Refer above template.
- In the same manner draw ‘Line arrow’ for the categories. Don’t forget to name the categories.
- Now for writing causes, color each cells of categories, as shown in the template.
You may also learn more about fishbone diagram from this article from asq.
You can also learn about SIPOC Diagram which is the tool which is to be used before starting any improvement projects. Learn about SIPOC Diagram from this article from Know Industrial Engineering.

Now or Never
We’ve got your back on your manufacturing journey — Stay in touch
Follow us for step-by-step guidance, templates, and insights that save time and reduce mistakes.
Know Industrial Engineering Platform – Helping manufacturing industry professionals worldwide since 2019

Nicely Explained 👍
Amazing
Well articulated article👍
Nicely written,easy to understand.
Great
Keep up the good work and continue sharing knowledge