This article describes how to work with A3 Problem Solving. A3 problem solving is a method used to solve problems. The different steps in the A3 problem solving can be arranged in a A3 sheet, hence the name. You can get the template from the below download button.
It is important that it is a problem-solving process, and not just filling in the blanks. You must also be aware that the A3 is a “living” document that is continuously filled in and updated.
You must therefore be prepared for the fact that you may find that several fields need to be further elaborated or even reworked, e.g. with new graphics, numbers or the like.
The A3 work can either be done in a team or alone. It is about constantly becoming more knowledgeable about the given problem, and therefore lots of Gemba visits, experiments and analyzes to constantly better understand the problem.
Download A3 Problem Solving (PPT) template
A3 problem solving is structured in a way so that you follow the PDCA wheel through the completion of A3. On the left side, all the sections are centered around the Plan phase, and only on the right side do we get started with Do, Check and finally Act as the last one.
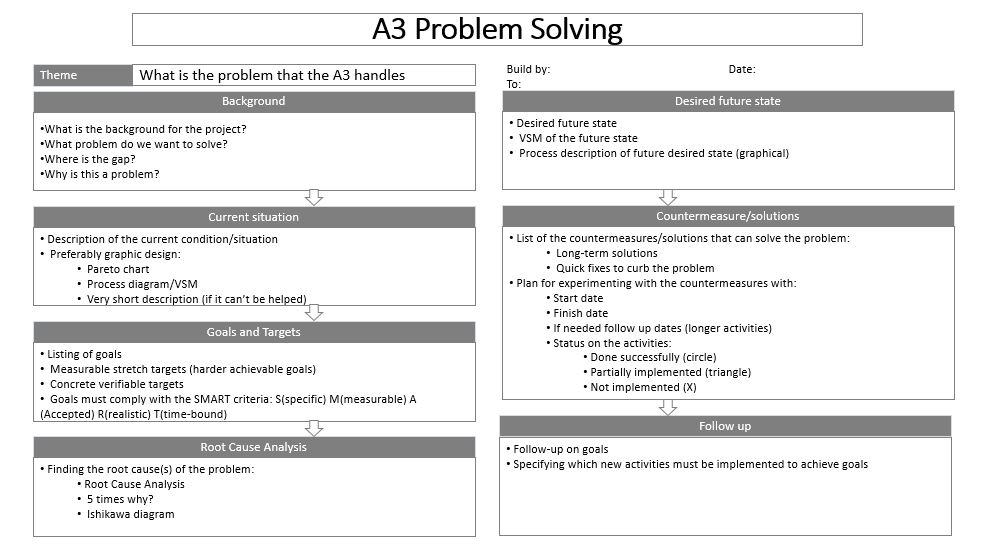
We will be discussing each steps in A3 problem solving template in following sections of this article.
Theme


See how Factovare helps factories digitize work
Watch the demo and contact us to try Factovare for your manufacturing operations.
Free Training Registration
Factovare Certified Manufacturing Excellence Professional (FCMEP)
Trainer: Founder of Factovare and Know Industrial Engineering
Learn directly from the person behind both platforms.
What you will learn
Enter your details and verify email OTP to reserve your seat.
Step 1: Enter your name and email address, then click Send OTP.
In this section, the problem, deviation or gap is indicated by a description. Examples of themes can be: “Reduction of scrap on the packaging machine”, “Improving productivity in the moulding department”, “Reduction of lead time in the filling plant” etc. The purpose of the theme is that you quickly get an idea of what the problem solving is all about. Just choose a working title to start with, you can always change it later when you are more sure of what the theme should be.
Background
This is a brief description of the background of the problem and where the gap between the standard (target) and where we are right now exists. It also describes why it is a problem and why we choose to spend energy on that particular problem. Describe how the problem relates to the overall strategy of the company or factory. Include historical data, preferably over time, eg. can you show the scrap percentage over a number of years or over several months, the productivity development over months or years, the development in the lead time over a period, etc. The background must set the framework for what the problem is about, and answer why it is important to deal with this problem right now.
Here you must obtain data and facts that can indicate the framework for the problem, and thus also indicate what is not included in the problem solution.
Current situation
In this section you must describe the current situation so that the problem, deviation or gap can be quickly understood and seen. You must concentrate on illustrating the current situation graphically, this can be based on VSM, process diagrams, pareto diagrams or other graphic illustrations that show the extent of the problem. Only if it cannot be avoided can you supplement with very short text in bullet form. This is where you have to be very specific with the problem, and be accurate in the representation of the problem. Make sure that it is 100% clear where the gap is and that you can clearly see it visually. You must try to quantify the gap as clearly as possible and preferably by means of calculations, such as percentage, number of defects, indication of downtime in hours etc.
Here you must spend time gathering all the necessary knowledge, data and facts, so that you can best illustrate the nature of the problem and its extent. This process may well take some time because you have to gather useful information, data and facts about the problem.
Goals and targets
Based on the background and current situation, you must now set goals for the A3 problem solving. In other words, you must state the goals for the change you will experience after the problem is solved. The goals must comply with the SMART criteria. An example of a good objective would be: “Increased productivity in the in the moulding area from 60% to 80% per 1 September 2021”. That way, there will be no doubt whether we have reached the goal. On 1 September 2021, we can see from the productivity figures whether we have reached the target or not.
Root Cause analysis
Here you must continue the investigation of the problem that you started under “Current situation”. The goal is for you to identify the root cause of the problem. Here you can choose to use the simplified PDCA problem solving model, or the slightly more comprehensive fishbone model (also called Ishikawa diagram). The PDCA problem solving model is described in my article (How to do Kaizen: Getting Started!”. The process of applying the fishbone model is to bring a team together for a brainstorm to identify possible root causes of a problem. These are noted down on post-its which are then hung up on the fish bone. When this work is finished, the same method is used as during PDCA problem solving, namely rejecting or confirming the possible cause, and then experimenting to test whether the possible cause is the root cause of the problem.
You can help yourself by asking the question: “Have we previously achieved the goal?” If so, what has changed since then? Can these changed factors give us a hint as to where the cause of the problem lies? Use 5 x why? And then check with the “therefore” technique. If we remove this cause, will the problem go away?
If it is a new goal that we have not previously achieved, dive into the gap between the current situation (status) and the new desired goal. Based on this gap, you then put forward a number of hypotheses, and test them to see if they are the reason why we have not previously reached the goal.
Desired future situation
In this section you must describe the desired future situation. This is where the future process is drawn as we want it to be. You should not think so much about why it cannot be done, but rather concentrate on getting the most optimal process described, in other words the most value-creating process. The illustration will typically be through a VSM or other form of process diagrams. Think about how the Lean principles can best be used and draw the process from this starting point. Make sure that the comparison with the current situation makes it clear what the difference between the two situations is. It is through this gap that you can find the countermeasures that can realize the desired future situation.
Countermeasures and solutions
In order to realize the desired future situation, you must now have found the countermeasures that can help with this. Typically, the problem, the root cause that we want to address, the proposed countermeasure, who is responsible and a deadline for when the countermeasure will be implemented are stated. A very common approach is to gather a team with different competencies and, through a brain storming session, come up with a number of proposals. These suggestions can then be tried in relation to the described root cause or problem. If the proposal appears to be a possible countermeasure, the proposal is written on the list of countermeasures and implemented. You can ask questions like: “Which activities will neutralize each hypothesis in the root cause analysis?”, “Can we change the conditions that create the causes?” etc. You have to concentrate on finding the exact set of countermeasures that can eliminate the causes of the problem. In the short term, it should be considered whether temporary countermeasures should be implemented to curb one or more of the causes of the problem.
Goal follow-up
While and after the countermeasures have been implemented, it is time to follow up on whether the countermeasures have had the desired effect. This is done by measuring the achieved effect with precisely the measurement methods and “measuring tools” that were defined in “Goals and targets” in the A3. It must be stated what the status is, how big the gap is and what measures are being initiated to close this gap. Follow-up is done with a fixed frequency, and the development in the individual “KPIs” is followed, and corrective measures are established if there is a lack of target achievement.
An example of this could be that we have a target of reducing our Change Over time with 20 min. We have now reached a reduction of 10 min. So we have a gap of 10 min. We now have to think if we have implemented our countermeasures well or if we have to come up with new countermeasures. So we go to the Gemba (Shop Floor) and confirm if the new process for the Change Over has been followed. We observe that that this is not the case and thus put in two countermeasures in: training/retraining of the operators and daily process confirmation for the next three months. We expect these countermeasures to close the gab by further 5 min. But under the observation we also discovered some flaws in the setup of the layout. So we set up a countermeasure of experimenting with the layout and thus expect to close the gab of the last 5 min.
Conclusion on article on A3 Problem Solving
This article has described how to do A3 Problems Solving. The method can be used as a tool where you do your problem solving alone (often used to train your Problem Solving muscle) or in a team. The process is the same. Just remember to not just use it as a “fill in the blanks”-exercise because it really is not! This is a way to train and further develop the Problem Solving skills in the organization.

Now or Never
We’ve got your back on your manufacturing journey — Stay in touch
Follow us for step-by-step guidance, templates, and insights that save time and reduce mistakes.
Know Industrial Engineering Platform – Helping manufacturing industry professionals worldwide since 2019

Nicely explain in simple way.
A3 is a widely used problem solving methodology, especially in the auto mobile sector. Thanks for simplifying it and bringing it up🙏