In the previous article, we talked about the different languages used by data scientists and the different open-source, commercial, and cloud-based software for doing different data science tasks.
In this article, we would be learning about:
- The important libraries used by the different programming languages.
- what is an API, and what is it used for?
- The different forms of data structures used to store data.
And in the end, we would be providing some websites in which you can find different types of data.

Learn about the providers of online masters in data science by clicking here
Libraries for Data Science
Libraries are a collection of functions and methods for doing some particular tasks. They are written by someone else and for using them we just have to import it to our program and call the functions we want.
Scientific Computing Libraries in python


See how Factovare helps factories digitize work
Watch the demo and contact us to try Factovare for your manufacturing operations.
FCMEP Three-Month Programme Registration
Factovare Certified Manufacturing Excellence Professional (FCMEP)
Trainer: Founder of Factovare and Know Industrial Engineering
Learn directly from the person behind both platforms.
Foundation session
Any one Tuesday · 1 hour
Trainer: Founder of Know Industrial Engineering and Factovare.
Doubt clearance
Alternate Thursdays · 09:00 PM IST · 1 hour
Trainer: Founder of Know Industrial Engineering and Factovare. Attend every eligible session during your active period.
Self-learning access
Three months of guided practice
Use selected Factovare modules and protected training materials to learn and practise throughout the programme.
You may attend any one Tuesday foundation session. Your three-month programme starts on the date you attend your first foundation session. From that date, you can self-learn using the training materials and eligible Factovare modules, and attend all eligible alternate-Thursday doubt-clearance sessions.
What you will learn
Enter your details, verify your email and complete the one-time $29 USD payment to join the three-month programme.
Step 1: Enter your name and email address, then click Send OTP.
Pandas
Pandas is Developed by Wes McKinney. Pandas is a software library for Python. It is used for data manipulation and analysis. Pandas provide tools to work with different types of data. The main tool that pandas provide is a way to represent the data in the form of a 2D table called a Data Frame. This allows the user to give an index to data and can use these indices to work with the data easily.
NumPy
Created by Travis Oliphant NumPy is a library for Python programming language based on arrays. This enables the user to perform different mathematical operations using these arrays which represent our data.
Visualization Libraries in python
Data Visualization is like telling a story where the different insights from data play different roles. It is one of the best ways to get insights about the data and also to communicate with others about the results you get from your analysis of that data.
Some of the most widely used visualization libraries in python are:
- Matplotlib – Most popular and easy to use
- Seaborn – Similar to matplotlib but more modern
- Plotly – provides functions to make interactive plots
- Altair – Used to generate maps
Machine Learning & Deep Learning Libraries in python
Scikit-learn
Developed by David Cournapeau scikit-learn contains tools for statistical modelling, including regression, classification, clustering, and many more. It is built using libraries like Scipy (similar to NumPy), Numpy, and matplotlib.
Keras
Keras is an open-source library with a high-level interface (functions that require very lengthy coding can be done using simple function call) used for building deep learning models easily with few codes. It can run on GPUs which makes training the models faster.
TensorFlow
Developed by the Google Brain team TensorFlow offers tools for large scale production and deployment of deep learning models. It uses a low-level framework which means we have to code a bit more than what we do in Keras. With the arrival of the newer version of TensorFlow, TensorFlow 2.0 Keras is now integrated with TensorFlow to make it a more higher-level framework.
PyTorch
PyTorch is developed by the fakebook’s AI Research(FAIR) lab . It is used for building deep learning models for different applications and it is open source.
Apache Spark
It is a general-purpose cluster computing framework that enables the user to process data using computer clusters (a group of systems). Because of this, we can process data parallelly by different systems. It has similar features like the NumPy, pandas, and matplotlib libraries. It can use Python, R, Scala, and SQL languages.
Scala-Libraries
Scala-libraries are usually used for data engineering. Following are some of the Scala libraries for data science:
- Vegas – For data visualization
- Big DL – For Deep Learning
R – libraries
R has several built-in functions for machine learning and data visualization. Some of the other complementary libraries that we can use in R to do these tasks are:
- Ggplot2 – For data visualization
- Libraries that allow interfacing with Keras and TensorFlow
Application Programming Interfaces (API)
Its an interface to connect two parts of a program. One might be written in another language and imported to our program through libraries. API would allow us to use that function in the program syntax of our program. The function might be written in another programming language.
Simply put, it links our program, that does some function to another piece of program, that does some other functions on the data we have.

For example, the TensorFlow library is a set of software components that does particular functions. The API helps us to use these function that is written in C++ in our Python or R program by using the object of TensorFlow.
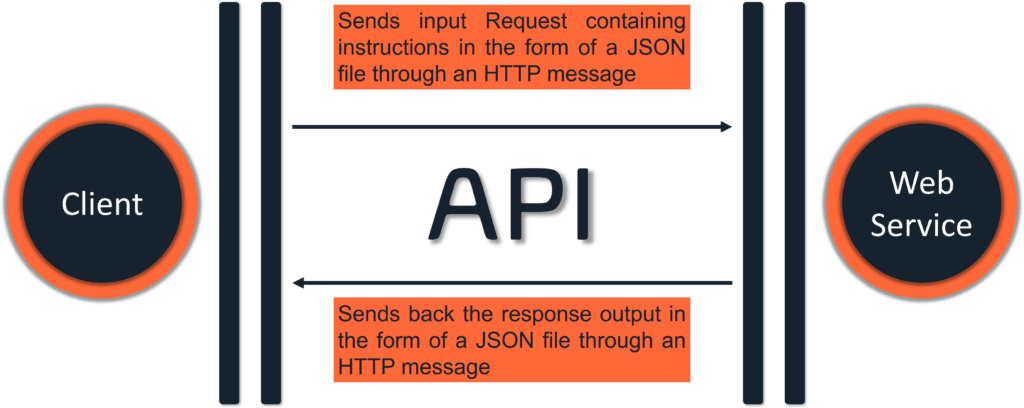
REST APIs (Representational State Transfer APIs)
In this type of APIs, the resources that we want to access is not in the form of libraries, that we can import and use directly in our program, but it is accessed through the internet.
Here our program is called a client and the resource we want to access is called a web service. The client and the web service communicate through HTTP messages. The message can be in the form of JSON, XML, or HTML formats.
The difference between API and REST API is, API is used to connect our program to a resource that we have already imported in our program without needing to connect to any external cloud resources. But in REST API we have to connect to the online service provider to use their resources
Data Sets
A dataset is a collection of structured data. It contains information in the form of text, multimedia, and other forms.
Important Data Structures:
Tabular data
In a tabular data structure, the information is stored in the form of rows and columns. The two most common examples are:
CSV – Comma-separated values, where each value is separated by a comma
XLSX – Data entered in an Excel File.

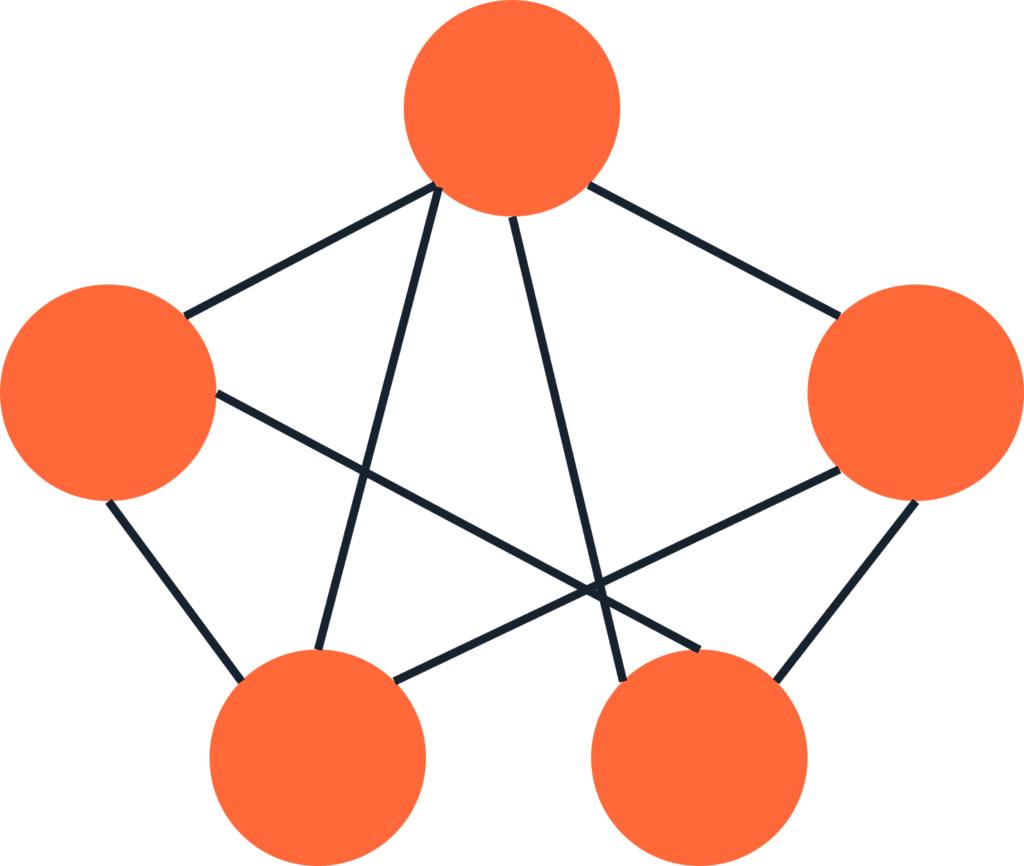
Hierarchical and Network Data
This represents relationships between data. For example, to know about the relationships between people in a social media platform we can use hierarchical or network data structures. Hierarchical is a tree-like structure where different branches represent the relationship and the leaves represent the data. The network data structure is represented as a graph.

Raw Data
Raw data includes data in the form of images, audio, and video files. A scanned document is also an example of raw data.
Types of data based on ownership
Private Data
Data owned by a person or a group that cannot be shared publicly. For example, personal photos or company details.
Public Data
Data that is available to the public provided usually by the government or organizations. For example, research data, weather data, etc.
Some sources to find datasets are:
- https://datacatalogs.org/
- http://data.un.org/
- https://www.data.gov/
- https://www.europeandataportal.eu/en
- https://www.kaggle.com/datasets
- https://datasetsearch.research.google.com/
Thank you
If you know any tiny subject that can be related to manufacturing industry or industrial engineering, you can earn some income by becoming article contributor of this website. For knowing more about it, please visit Join us page.
You don’t need to have any experience in article writing, just knowledge on the subject is needed.
Also you can know more about our team of article contributors by visiting the about us page.
About the Author

Deepak Jose is a B-Tech CS student with a passion for Data Science. Loves learning about Data Science, coding, and science in general. Does data analysis and visualization as a hobby. Even though I’m in the Computer Science path I always find time to learn about space, automobiles, geography, energy, architecture, arts, etc. Loves solving problems and learning about new inventions.
Now or Never
We’ve got your back on your manufacturing journey — Stay in touch
Follow us for step-by-step guidance, templates, and insights that save time and reduce mistakes.
Know Industrial Engineering Platform – Helping manufacturing industry professionals worldwide since 2019

Truly quite fascinating post. I was searching for this sort of data and delighted in perusing this one. Continue posting. Thanks for sharing the post.