


What is Data Science?
Data Science as the name suggests is a field of science that deals with data. It combines the power of computers and mathematics for analyzing data, extracting important information from it and process this information for getting a useful output.

Learn about the providers of online masters in data science by clicking here
How can we use Data Science?
There are two ways in which we can use data science:
- Finding a solution to a problem by analyzing the data.
- Analyzing the data and come up with new ideas that can be implemented or come up with new problems that can be solved with it.
Classifications of Data Science
Data Science can be classified into the following:
- Data Collection
- Data Analysis
- Data Visualization
We will take a brief look at each of these three…
Data Collection
In philosophy, we call the things that are known or are assumed as facts which makes the basics of reasoning and calculation as DATA. Collecting data has been one of the most common things that humans have been doing for ages.
Our ancestors used to collect data in rocks and stones for remembering the number of their cattle or to create memories about their life or the knowledge they have gained which they wanted to pass on to the next generation.
In the modern world, the basic purpose of collecting data is for using it to find solutions to existing problems.
We collect data mainly in these different forms like:
- Sound data
- Visual data
- Text data
Types of data
The two main types of data are:
Structured data
Structured data is information that is organized. For example, a data set which contains names and roll numbers in two different column.
Unstructured data
These are a collection of information that is not processed. Examples are IoT sensor data, emails, chats, etc.
Data Analysis
Now that we have collected the data, for finding the solution to the problem that we have, we need to analyse the data.
The process of analyzing data using different tools like R, Python, MATLAB, etc. (We can use the libraries available in these programming languages for analyzing data by plotting graphs or charts) is called data analysis.
For example, consider the problem of housing price prediction. Imagine we have a dataset containing the prices of houses over the past 10 years. We would like to predict the price of the house in the coming year using this data.
One way we could do this is by plotting a graph where on the x-axis we give the years and, on the y-axis, we give the price of houses. When we plot the data like that, we would be able to see a pattern in which the prices of the house are increasing or decreasing over time.
And now by using this trend we would be able to predict the possible increase in price for a house in the coming years.
Data Visualization
Data visualization is a tool that is used to explain the data using graphical representations of the data. It helps the data analyst to understand different patterns in data and outliers and trends in data.
Also, the data analyst can use the visualization techniques to present his findings to the customer in the form of graphs, charts and maps.
Some of the different libraries in python for data visualization are:
- Plotly
- Seaborn
- Ggplot
- Altair
- Matplotlib
- Bokeh
- Folium
If we are not using a programming language for visualization, we can use below tools:
- Google charts
- Tableau
- Xplenty
- Hubspot
- Whatagraph
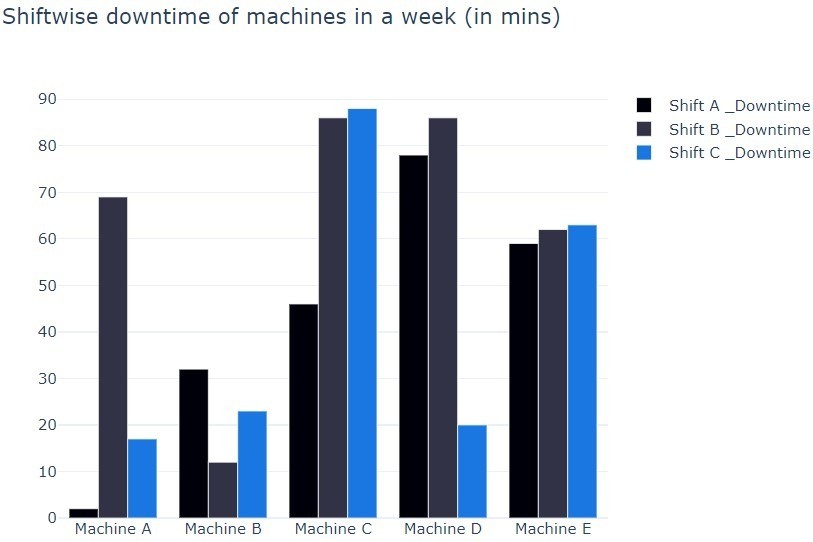
Data visualization example
We shall see an example of data visualization of data about three machines A, B, C, D and E for the period 01-10-2020 to 07-10-2020, done in python programming language using Plotly library.


Subsets of Data Science

Artificial Intelligence
AI – Artificial Intelligence is the intelligence that enables machines to think like a human and find solutions to problems with little or no human intervention. There are mainly 3 types of AI:
Artificial Narrow Intelligence (ANI)
Narrow AI is the most common form of AI that machines have these days. ANI allows machines to be automated and do a particular task or a small set of tasks all on its own, with very little or no human intervention.
It doesn’t have emotions or feelings of consciousness. It cannot do a wide variety of tasks if it isn’t programmed for it.
Examples:
- Self-driving cars
- Auto – Pilot
- Spam Filters
- Chatbots
Artificial General Intelligence (AGI)
This type of AI can only be seen in sci-fi movies and can exhibit human-level intelligence. This type of AI would be hard to distinguish from normal humans and would be able to show emotional intelligence.
They can think like human beings and would be able to solve problems based on situations rather than just system needs. In other words, if there is a situation where a particular solution to a problem might be harmful to someone else, at this situation the machine might choose another solution.
Artificial Super Intelligence (ASI)
This type of AI will have an intelligence level that would be far superior to humans and would be able to think much faster than us. They would have greater problem-solving skills and updates themselves which would be more brilliant than the one before, all in just a matter of days.
They would have the ability to evolve quickly and become the better versions of themselves. This type of intelligence can even be a threat to our existence.
Machine Learning
Machine learning is the process of teaching a machine to accept inputs and do calculations based on algorithms build upon statistics and probability, to come up with an output, that is closer or equal to the expected output.
We can see the use of machine learning in our day to day life, for example, the recommendation system in YouTube or Instagram ads is all based on machine learning where the data of what the user clicks the most and likes the most is fed into a system and the system learns about the user’s interests and it suggests the contents that the user is most interested in.
Machine learning is classified mainly into 3 types of learning:
1.Supervised Learning
Let’s say we want our machine to classify images of apple from a set of other images. In supervised learning, we will initially provide the ML-model input images and labels according to the name of the fruit in the image.
An ML-Model is a set of algorithms that learn different features from input data and gives an output.
The model would compare the image and label and learn the features that map a particular image to a particular label.
And now when we give the model a new image it would be able to identify the same features that it had seen in the data, that we had used to train it and would map the image to the particular label.
Common supervised learning problems:
- Classification: Classification group’s the output to categories that are previously given to it as labels. For example 0,1, cat, mouse, apple, mango, etc.
- Regression: Regression is used to predict a continuous quantity. For example predicting live temperature in room. Stock market price prediction is also an example.
2.Unsupervised Learning
In unsupervised learning, the model is provided with input data without any labels. The model would categorize the data into different groups based on similar features. Unsupervised learning is mainly used for two types of problems:
- Clustering: Clustering identifies features that are similar between data and classifies according to these similarities. The model itself classifies input data according to similar features in data. For example, clustering peoples to different groups based on the spread of COVID-19 in their area.
- Association: For example, associating a particular product to a buyer based on another product he brought recently (mapping).
3.Reinforcement Learning
Its like teaching a baby what’s right and wrong. If he does right we will appreciate him, by giving him some chocolates, gifts, etc.. and we will give him a feedback if he does something wrong. So next time if he does something he would know that it is good or bad based on feedbacks or rewards he got before while doing the same.
So, reinforcement learning is a reward-based system in which an agent interacts with an environment by performing some actions and learn from rewards (either negative or positive) obtained from interpreter . There is no predefined data and no supervision. Follows a trial-and-error method for learning. It should identify an output by itself and we would just say if its right or wrong.
Examples:
Self driving cars where the environment is road and the interpreter (error signal generator) is a human in the driving seat. The human sends a signal based on the direction the car automatically takes or maybe the lane changes the car makes or maybe while parking if it follows the rules.
An automated machine that is used for categorizing products into different groups based on its weight. The person who monitors the task would generate an error signal which is negative if the machine classify the product wrongly and it would give positive response if the machine does it correctly
In addition to these, there is another type of learning called semi-supervised in which some data is labelled and others are unlabelled.
4.Deep Learning
Deep learning is a subset of machine learning where we use artificial neural networks for doing the supervised, unsupervised, and reinforcement learning tasks.
Artificial Neural Networks (ANNs) are inspired by the neurons in the human brain. In deep learning, we use multiple layers of neurons connected in which one layer of the neuron will learn a particular feature from the input and the output is passed through a function, which mostly uses some probabilistic equations to identify the useful features and pass it as an input to the next layer and so on, until it reaches the final layer where we get an output.
Benefits of using neural networks
Neural network can have lots of layer’s, each having number of neurons. So even if one neuron isn’t performing well the model would identify it and won’t affect the performance. Also the data (input data and the features identified from data) is stored in the neurons itself in form of numbers. So we don’t have to use a separate database for storing these data.
Also neural networks, can be manipulated to whichever way we want for different tasks. it can be used for solving multiple problems, basically like our brain can do lots of things by firing different sets of neurons.
The two main areas in which Deep Learning is used the most are:
Computer vision
Computer vision is a field of artificial intelligence that uses deep learning to learn about the visual world. We know that an image is a collection of pixel values. In the computer, we represent these values as numbers in the matrix.
These numbers are fed into the neural networks which would then learn the features of the image and would be able to either classify an image or to detect an object in the image.
A type of neural network called Convolutional Neural Networks (CNNs) is used commonly for this. Some of the most common applications of computer vision are:
- Defect detection in manufacturing
- Self-driving cars
- Intruder detection
Natural Language Processing
NLP is a field of artificial intelligence that uses the power of neural networks to understand human language in a useful way. NLP can be used to read, understand, and create natural language. Some of the applications of NLP are:
- Google Translate
- MS Word, Grammarly – for grammar check or spellcheck
- Siri, Alexa – Personal Voice Assistant
If you have decided to go ahead with data science, you can refer out next article on data science.
Thank you
If you know any subject that can be related to manufacturing industry or industrial engineering, you can earn some income by becoming article contributor of this website. For knowing more about it, please visit Join us page.
You don’t need to have any experience in article writing, just knowledge on the subject is needed.
Also you can know more about our team of article contributors by visiting the about us page.
About the Author

Deepak Jose is a B-Tech CS student with a passion for Data Science. Loves learning about Data Science, coding, and science in general. Does data analysis and visualization as a hobby. Even though I’m in the Computer Science path I always find time to learn about space, automobiles, geography, energy, architecture, arts, etc. Loves solving problems and learning about new inventions.
LATEST ARTICLES FROM KNOW INDUSTRIAL ENGINEERING
- What is Ergonomics in Manufacturing and Why Does It Matter?What is Ergonomics? Ergonomics is the science of designing workstations, tools, equipment, and tasks to fit the worker. Advertisement The goal is to make work safer, more comfortable, and more efficient. In simple terms Instead of asking: “How can the operator adapt to the workstation?” Ergonomics asks: “How can we design the workstation so the… Read more: What is Ergonomics in Manufacturing and Why Does It Matter?
- Stories from the Factory Floor #05“We have always done it this way.” The sentence came up three times during the meeting. Advertisement The team was discussing a process that required six approvals before a job could move to production. Nobody could explain why all six were still necessary. So they went looking. Approval 1 was added after a quality issue… Read more: Stories from the Factory Floor #05
- What are the 8 Wastes in Lean Manufacturing?What is Waste in Manufacturing? In Lean Manufacturing, waste means any activity that consumes resources but does not add value from the customer’s perspective. Advertisement A process can look busy and still contain significant waste The 8 Wastes Simple Example An operator produces a component in 30 seconds, but spends another 10 seconds walking to… Read more: What are the 8 Wastes in Lean Manufacturing?
- Stories from the Factory Floor #04The customer called three times. Same complaint. Advertisement “The product is good, but it is difficult to use.” Quality checked the product. It passed every test. Production checked the process. Everything was within standard. Engineering checked the drawings. No problem there either. So the team visited the customer. They watched how the product was actually… Read more: Stories from the Factory Floor #04
- What are Manufacturing KPIs and Why Are They Important?What is a Manufacturing KPI? A Manufacturing KPI (Key Performance Indicator) is a measurable value used to understand how effectively a manufacturing process is performing. Advertisement KPIs turn production performance into data that can be monitored and improved. In simple terms Instead of saying: “Production seems slow.” A KPI helps quantify it: Output = 8,500… Read more: What are Manufacturing KPIs and Why Are They Important?
- Stories from the Factory Floor #03“Don’t change anything.” That was the instruction from the Production Manager. Advertisement The line had been running for years. Same machines. Same layout. Same work method. Same problems. One young engineer noticed that operators were making the same small adjustment almost every hour. She asked why. An operator replied: “Because the machine doesn’t work properly… Read more: Stories from the Factory Floor #03
- What is Performance Rate and Why Is It Important in Manufacturing?What is Performance Rate? Performance Rate measures how fast a machine or production process operates compared with its ideal or planned production speed while it is running. Advertisement It helps answer: “When the machine is running, is it producing as fast as it should?” In simple terms A machine may be available for production but… Read more: What is Performance Rate and Why Is It Important in Manufacturing?
- Stories from the Factory Floor #02“Why are we producing this?” Nobody answered. Advertisement The Production Manager looked at the planning sheet. The order was approved. The material was available. The machine was ready. So production continued. Two days later, the finished products were sitting in the warehouse. Nobody was asking for them. The Planning Manager checked the customer order. The… Read more: Stories from the Factory Floor #02
- What is Quality Rate and Why Is It Important in Manufacturing?What is Quality Rate? Quality Rate measures the proportion of produced units that meet the required quality standards compared with the total units produced. Advertisement It helps answer: “How much of what we produced was good without being rejected?” In simple terms If a process produces 1,000 units and 30 units are defective: Good units… Read more: What is Quality Rate and Why Is It Important in Manufacturing?
- Stories from the Factory Floor #01“We don’t have it.” The Plant Head thought he had heard wrong. Advertisement “What do you mean?” “One component is out of stock.” The entire production line was ready. Operators were waiting. Machines were ready. Orders had to be shipped. The missing component? It cost less than ₹20. “Check the warehouse.” Nothing. “Check incoming material.”… Read more: Stories from the Factory Floor #01
- What is Voice of the Customer (VOC) and Why Does It Matter in Manufacturing?What is Voice of the Customer? Voice of the Customer (VOC) is the process of collecting and understanding customer needs, expectations, requirements, and feedback. Advertisement It helps manufacturers understand what customers actually value not just what the company assumes they value. In simple terms A customer may say: “I need faster delivery.” But the real… Read more: What is Voice of the Customer (VOC) and Why Does It Matter in Manufacturing?
- What is PMTS and How Can It Help Determine Standard Time?What is PMTS? PMTS stands for Predetermined Motion Time System. Advertisement It is a work measurement technique used to determine the time required to perform a task by analyzing the basic human motions involved, rather than measuring the entire task repeatedly with a stopwatch. In simple terms Instead of asking: “How long did this operator… Read more: What is PMTS and How Can It Help Determine Standard Time?
- What is Heijunka and How Does Production Leveling Improve Factory Flow?What is Heijunka? Heijunka is a Lean manufacturing method used to level production volume and product mix over time. Advertisement Instead of allowing demand fluctuations to create highly uneven production schedules, the goal is to create a smoother and more predictable workload. In simple terms Imagine customer demand requires: A factory could produce all of… Read more: What is Heijunka and How Does Production Leveling Improve Factory Flow?
- What is Production Mix and Why Does It Matter in Manufacturing?What is Production Mix? Production Mix refers to the combination and quantity of different products a factory produces during a specific period. Advertisement A factory may have enough total capacity, but the product mix can still create a capacity problem. In simple terms Suppose a factory produces: 🔹 Product A🔹 Product B🔹 Product C Each… Read more: What is Production Mix and Why Does It Matter in Manufacturing?
- What is Production Planning and Control (PPC) and Why Is It Important?What is Production Planning and Control? Production Planning and Control (PPC) is the process of deciding what to produce, how much to produce, when to produce it, and how to control the production process to meet customer requirements. Advertisement In simple terms PPC connects: Customer Demand → Production Plan → Materials → Machines → Manpower… Read more: What is Production Planning and Control (PPC) and Why Is It Important?
- What is Queue Time and How Does It Affect Manufacturing Lead Time?What is Queue Time? Queue Time is the time a job spends waiting before the next operation can begin. Advertisement The product is not being processed during this period it is simply waiting. In simple terms Manufacturing time can include: Processing Time + Waiting Time + Movement Time + Inspection Time A product may require… Read more: What is Queue Time and How Does It Affect Manufacturing Lead Time?
- What is Downtime Analysis and How Can It Improve Production?What is Downtime Analysis? Downtime Analysis is the systematic study of when, why, and how long production equipment or processes remain unavailable for production. Advertisement Instead of simply recording: “Machine stopped for 2 hours.” Industrial Engineers investigate: “Why did it stop, how often does it happen, and what is causing the biggest loss?” In simple… Read more: What is Downtime Analysis and How Can It Improve Production?
- What is Resource Utilization and Why Does It Matter in Manufacturing?What is Resource Utilization? Resource Utilization measures how effectively available manufacturing resources are being used compared with their available capacity. Advertisement Resources can include: In simple terms If a machine is available for 8 hours but actually produces for only 6 hours, its utilization is: 6 ÷ 8 × 100 = 75% The remaining 25%… Read more: What is Resource Utilization and Why Does It Matter in Manufacturing?
- Revisiting my Production Engineering subjects: SCT College, 2006–2010By Melvin Vincent In 2006, I joined Sree Chitra Thirunal College of Engineering, Trivandrum, to pursue B.Tech in Mechanical Engineering, Production Engineering stream, under the University of Kerala. I graduated in 2010. Advertisement Years later, I feel like opening those books again. Some lessons have stayed with me; others need a little refreshing. I am… Read more: Revisiting my Production Engineering subjects: SCT College, 2006–2010
- Elon Musk Says Money Won’t Matter in the Future. Is It Already Happening?Elon Musk has repeatedly discussed a future where AI and robotics could create such enormous productivity that many goods and services become extremely abundant. It sounds difficult to imagine. Advertisement But look at the past. We may already have experienced smaller versions of the same transformation. Things That Once Cost Money but Are Now Almost… Read more: Elon Musk Says Money Won’t Matter in the Future. Is It Already Happening?
- What leads to recent 4.3 Million EVs Recall – An analysisIn August 2026, nine vehicle manufacturers announced recalls covering approximately 4.276 million electric vehicles in China. The recalls centred on a safety mechanism that was already present in the affected vehicles: the mechanical emergency door release. This was not simply a case of millions of defective door latches. The concern arose from what could happen… Read more: What leads to recent 4.3 Million EVs Recall – An analysis
- Understand how money works through This story of Adam and BenImagine Earth thousands of years ago. There is only one man. Let’s call him Adam. Advertisement Adam wakes up hungry. He catches a fish. He eats it. Later, he wants shelter. So he cuts some wood and builds a small hut. He wants water. He walks to the river and collects it. There is no… Read more: Understand how money works through This story of Adam and Ben
- Mukesh Ambani’s Three Success Rules Every Manufacturing Professional Should FollowManufacturing professionals are trained to solve problems. A machine stops, we restore it. A line misses its target, we rebalance it. Rejection increases, we search for the root cause. Yet one important problem often remains unattended: Are we building only a successful process, or are we also building a successful career? Many capable engineers spend… Read more: Mukesh Ambani’s Three Success Rules Every Manufacturing Professional Should Follow
- Neuralink Blindsight: When the Brain Becomes the DisplayFor most of human history, vision has followed one path: light enters the eyes, the eyes convert it into signals, and the brain interprets those signals. Neuralink’s Blindsight is exploring a radically different possibility: What if visual information could reach the brain without depending on the eyes? Advertisement That idea makes Blindsight much more than… Read more: Neuralink Blindsight: When the Brain Becomes the Display
- Factories are going to change anyway – Before that change yourselfWalk into a factory today and you may see operators filling production sheets, supervisors updating Excel files, engineers conducting time studies with stopwatches, planners manually changing schedules, quality teams maintaining separate records, and managers waiting until the next morning to understand what actually happened on the shop floor. Much of this may still look normal.… Read more: Factories are going to change anyway – Before that change yourself
- Edge AI in Manufacturing: How Factories Make Intelligent Decisions Without Depending on the CloudEdge AI brings artificial intelligence closer to factory machines, cameras, sensors and production processes. Explore how it works, where it can be used and what manufacturers should evaluate before implementation.
- What Is Culture Actually? A Simple Explanation With Real Workplace ExamplesMany people think culture means company values, motivational posters, annual day celebrations, team photos, or a statement written on the office wall. But culture is much deeper than that. Advertisement Culture is not what a company says. Culture is what people actually do every day. In simple words: Culture is the repeated behavior of people… Read more: What Is Culture Actually? A Simple Explanation With Real Workplace Examples
- Self Respect – You May Be Forgotten, But Do Not Forget YourselfThere is a powerful meaning behind the line: “You will be forgotten either way. So live in such a manner that, while you remain, you belong to yourself.” Advertisement At first, it may sound negative. But actually, it is a very practical reminder for life and career. Do Not Live Only for Recognition Most people… Read more: Self Respect – You May Be Forgotten, But Do Not Forget Yourself
- IntralogisticsIn manufacturing, people often talk about production, quality, maintenance, automation and supply chain. But there is one area that quietly decides the speed of the entire factory: intralogistics. A factory may have good machines, skilled operators and proper planning. Still, if materials are not available at the right place, in the right quantity and at… Read more: Intralogistics
- 3PL Ecommerce in ManufacturingManufacturing is no longer only about producing goods and sending them to distributors. Today, many manufacturers are also selling directly to customers, dealers, retailers, and online buyers through ecommerce platforms. This shift has created a new challenge: how can a manufacturer manage storage, order picking, packing, shipping, and returns without disturbing core production activities? This… Read more: 3PL Ecommerce in Manufacturing
Now or Never
We’ve got your back on your manufacturing journey — Stay in touch
Follow us for step-by-step guidance, templates, and insights that save time and reduce mistakes.
Know Industrial Engineering Platform – Helping manufacturing industry professionals worldwide since 2019
Discover more from Know Industrial Engineering
Subscribe to get the latest posts sent to your email.

well done deepak