Data Scientists across the world use Python as their go-to programming language for Data Science. This is due to the presence of a vast set of libraries that offers solutions to every problem in the stream of Data Science. And also due to the fact that Python is easy to learn and use, due to its spoken language-like syntax. All these make python a powerful tool for Data Science.
There is a self assessment test at the end of this article. Take that test and assess your knowledge related to Python Libraries for Data Science after reading this article.
What makes python so powerful and popular is its Data Science libraries. These include Pandas, NumPy, and Scikit-Learn which offer functions that turn insights from your data into magical tools that you can use for your business purposes.
In this article, we will learn about the 11 most important Python libraries for Data Science, which would help you to become a successful Data Scientist. We will be also discussing its installation, important functions, and code.
Before we begin if you want to learn more about Data Science read the below articles.
- Introduction to Data Science
- Languages and Tools you should know to become a Data Scientist
- Tools for Data Science
- Statistics for Data Science – Descriptive Statistics
- Complete Data Science Roadmap – With resources
- Introduction To Natural Language Processing


See how Factovare helps factories digitize work
Watch the demo and contact us to try Factovare for your manufacturing operations.
FCMEP Three-Month Programme Registration
Factovare Certified Manufacturing Excellence Professional (FCMEP)
Trainer: Founder of Factovare and Know Industrial Engineering
Learn directly from the person behind both platforms.
Foundation session
Any one Tuesday · 1 hour
Trainer: Founder of Know Industrial Engineering and Factovare.
Doubt clearance
Alternate Thursdays · 09:00 PM IST · 1 hour
Trainer: Founder of Know Industrial Engineering and Factovare. Attend every eligible session during your active period.
Self-learning access
Three months of guided practice
Use selected Factovare modules and protected training materials to learn and practise throughout the programme.
You may attend any one Tuesday foundation session. Your three-month programme starts on the date you attend your first foundation session. From that date, you can self-learn using the training materials and eligible Factovare modules, and attend all eligible alternate-Thursday doubt-clearance sessions.
What you will learn
Enter your details, verify your email and complete the one-time $29 USD payment to join the three-month programme.
Step 1: Enter your name and email address, then click Send OTP.
Learn about the providers of online masters in data science by clicking here
Let’s dive deep into the 11 most essential python libraries you must learn to become a successful Data Scientist.
1. NumPy
Used by Data scientists across the world for scientific computing, Numpy is a powerful open-source library written in C programming language. NumPy provides data structures like multidimensional arrays, matrices, etc., for various math operations. As a result, NumPy is the base library for various powerful data science libraries. Therefore Learning NumPy should be one of your first steps in becoming a Data Scientist. Even though it seems a bit similar to python lists, it consumes lesser memory and is way faster than a list.
Visit the official NumPy website to know more.
Installation
If you have already installed python on your machine then go to the terminal(cmd in windows) and type the following code.
pip install numpyOr if you have anaconda installed on your machine then open the anaconda prompt and type the following code.
conda install -c anaconda numpyExample code
If you have installed anaconda in your machine, then you can use Jupiter notebook to test these codes. Or you can use any other code editor as per your wish.
1. Creating an array
The following code is used to create a NumPy array.
Code :
#importing the library
import numpy as np

a = np.array([(8, 9, 10), (11, 12, 13)])
print(a)
output:
[[8 9 10]
 [11 12 13]]
2. min and max:
These functions return the minimum and maximum value of the numbers in a NumPy array.
Code :
arr = np.array([1,2,3,4,5])
print(np.max(arr), np.min(arr))
Output :
5 13. std:
This function returns the standard deviation of the numbers in a NumPy array.
Code :
arr = np.array([1,2,3,4,5])
print(np.std(arr))
Output :
1.41421356237309514. mean:
This function returns the mean value of the numbers in a NumPy array.
Code:
arr = np.array([1,2,3,4,5])
print(np.mean(arr))
Output:
3.05. median:
This function returns the median of the numbers in a NumPy array.
Code :
arr = np.array([1,2,3,4,5])
print(np.median(arr))
Output :
3.06. percentile:
This function returns the percentile of the numbers in a NumPy array. Which is the number under which that percentage of numbers resides.
Code :
arr = np.array([1,2,3,4,5])
print(np.percentile(arr,25)) #prints 25th percentile
print(np.percentile(arr,50)) #prints 50th percentile
print(np.percentile(arr,75)) #prints 75th percentile
Output
2.0
3.0
4.0
7. linspace:
This function gives evenly spaced numbers within a specified interval.
Code:
print(np.linspace(2.0, 3.0, num=5, retstep=True))

"""
Here 2 is the lower limit and 3 is the upper limit.
Num=5 means we need to generate 5 numbers between 2 and 3.
retstep = True means the stepcount is returned.
"""
Output :
(array([2.  , 2.25, 2.5 , 2.75, 3.  ]), 0.25)
"""
Here 0.25 is the step count.
"""
8. shape:
This function returns the shape of an array.
Code :
arr = np.array([[1,2,3,4,5],[6,7,8,9,10]])
print(arr)
print(np.shape(arr))
Output :
[[ 1  2  3  4  5]
 [ 6  7  8  9 10]]
(2, 5) #Two rows and 5 columns
9. reshape:
This function used to reshape a NumPy array.
Code :
arr = np.array([[1,2,3,4,5],[6,7,8,9,10]])
print(arr,"\n")
print(arr.reshape(5,2))
Output :
[[ 1  2  3  4  5]
 [ 6  7  8  9 10]]
[[ 1  2]
 [ 3  4]
 [ 5  6]
 [ 7  8]
 [ 9 10]]
10. transpose:
This function is used to reverse the axes of the NumPy array.
Code :
arr = np.array([[1,2,3,4,5],[6,7,8,9,10]])
print(arr,"\n")
print(np.transpose(arr))
Output :
[[ 1  2  3  4  5]
 [ 6  7  8  9 10]]
[[ 1  6]
 [ 2  7]
 [ 3  8]
 [ 4  9]
 [ 5 10]]
11. sort:
This function is used for sorting the NumPy array.
Code :
arr = np.array([11,2,30,4,5])
print(arr, "\n")
print(np.sort(arr))
Output :
[11  2 30  4  5]
[ 2  4  5 11 30]
2. SciPy
SciPy which stands for Scientific Python is a scientific computation library that is designed on top of NumPy. It provides functions that can be used to find mathematical formulas like the determinant of a matrix, eigenvalues, Eigenvectors, etc. Written in Python programming language it is slower than NumPy but provides much more functionalities. It is also used for solving problems like integration, optimization, linear algebra, and statistics.
Visit the official SciPy website to know more.
Installation
For the python environment use the following code.
pip install scipyFor the conda environment use the following code.
conda install -c anaconda scipyExample Code
Here we would see some examples of using the library.
Importing the necessary libraries
We would start by importing the libraries we would be using in these example codes.
import numpy as np
from scipy import linalg
Now we would see the code to do different functions using this library.
1. Code to find the Determinant of a Matrix.
arr = np.array([[4,2,3],[4,5,6],[9,8,9]]) #creating a matrix using numpy
linalg.det(arr)
Output :
-15.02. Code to find the Eigen values and Eigen vectors of this matrix.
We would be using the array we have built above to find these.
eig_vals, eig_vects = linalg.eig(arr)
print(eig_vals)
print(eig_vects)
Output :
[16.88108059+0.j  1.65561839+0.j -0.53669898+0.j]
[[-0.26938637 -0.68838898 -0.19730392]
 [-0.5048473   0.72319052 -0.65139713]
 [-0.82009767  0.05582181  0.73263425]]
3. Matplotlib
Data Visualization is an important skill set to have in becoming a successful Data Scientist. And its examples include bar graphs, pie charts, scatter plots, etc. Data Scientists use these graphs to easily understand insights from data.
Matplotlib is an open-source library built on NumPy arrays. It is a comprehensive library that consists of several plots like line, bar, scatter, histogram, etc. To know more about this visit the official Matplotlib website.
Installation
For the python environment use the following code.
pip install matplotlibFor the conda environment use the following code.
conda install -c conda-forge matplotlibExample Code
Here we would see some examples of using the library.
Importing the necessary libraries
We would start by importing the libraries we would be using in these example codes.
import matplotlib.pyplot as pltNow we would see the code to do different functions using this library.
1. Code to draw a Line Plot.
x = [4,5,3,1,2] #values on x-axis
y = [10,9,6,8,7] #values on y-axis


plt.plot(x,y) #plotting funtion
plt.show()
Output :

2. Code to draw a Bar Plot.
x = [4,5,3,1,2] #values on x-axis
y = [10,9,6,8,7] #values on y-axis

plt.bar(x,y) #plotting funtion
plt.show()
Output :

3. Code to draw a Histogram.
y = [10,9,6,8,7] #values on y-axis

plt.hist(y) #plotting funtion
plt.show()
Output :

4. Code to draw a Pie Chart.
langs = ['C', 'C++', 'Java', 'Python', 'PHP']
students = [23,17,35,29,12]

plt.pie(students, labels=langs,autopct='%1.2f%%')
plt.show()
Output :

4. Seaborn
Built on top of Matplotplib seaborn is a high-level interface for drawing statistical graphs. Visit the official Seaborn website to know more.
Installation
For the python environment use the following code.
pip install seaborn
For the conda environment use the following code.
conda install -c anaconda seabornExample Code
Here we would see some examples of using the library.
Importing the necessary libraries
We would start by importing the libraries we would be using in these example codes.
import seaborn as snsNow we would see the code to do different functions using this library.
Code to draw a Lmplot.
Used to represent a linear regression model that shows the relationship between two variables (x & y).
# Loading the sample dataset that comes with seaborn
df = sns.load_dataset("anscombe")

# Show the results of a linear regression
sns.lmplot(x="x", y="y", data=df)
Output :

5. Pandas
Pandas is built on top of two main Python libraries – NumPy and matplotlib. Using these libraries pandas offer fast methods to work with datasets. It is used for loading datasets, cleaning them, transforming them, etc. As a result, the pandas library is one of the most important libraries that you must learn.
Visit the official Pandas website to know more.
Installation
For the python environment use the following code.
pip install pandasFor the conda environment use the following code.
conda install -c anaconda pandasExample code
Here we would see some examples of using the library.
Importing the necessary libraries
We would start by importing the libraries we would be using in these example codes.
import pandas as pd
import numpy as np
Now we would see the code to do different functions using this library.
1. Code for Creating a series.
Pandas series is a one-dimensional array that is capable of holding data of any type. It can be compared with a column in an excel sheet. We can create it from lists, dictionaries, NumPy arrays, etc. But in the real world, it will be loaded from databases, CSV files, Excel sheets, etc.
data = np.array(['a','b','c','d']) #using numpy array
data1 = ['q','r','s','t'] #using list
data2 = {'Names':['Depak','Melvin','Abi','Meet']} #using dictionary

print(pd.Series(data),'\n')
print(pd.Series(data1),'\n')
print(pd.Series(data2))
Output :
0 a
1 b
2 c
3 d
dtype: object
0 q
1 r
2 s
3 t
dtype: object
Names [Depak, Melvin, Abi, Meet]
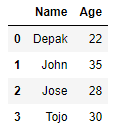
dtype: object2. Code for Creating DataFrame.
A DataFrame is a table-like data structure that can store values in rows and columns. It can be compared to an excel sheet with rows and columns. Each of the columns can represent a variable whose values are stored in that column. Each of the rows represents the different samples for these different variables.
data = {'Name':['Depak','John','Jose','Tojo'],
        'Age':[22, 35, 28, 30]}

df = pd.DataFrame(data)

df #can only be done while using a notebook, use print otherwise
#print(df)
Output :
6. scikit-learn
Built on NumPy, SciPy, and Matplotlib scikit-learn offers simple and efficient functions for predictive data analysis. Some of the examples of these functions are Linear Regression, Logistic Regression, KNN, etc. This library is most commonly used for building machine learning models for business applications.
Visit the official scikit-learn website to know more.
Installation
For the python environment use the following code.
pip install -U scikit-learnFor the conda environment use the following code.
conda create -n sklearn-env -c conda-forge scikit-learnLet’s now see an example code. In this code, we create a linear regression model that predicts salary based on age.
Example Code
Here we would see some examples of using the library.
Importing the libraries
We would start by importing the libraries we would be using in these example codes.
from sklearn.linear_model import LinearRegression as LRNow we would see the code to do different functions using these libraries.
1. Code for Creating our Dataset.
dataset = pd.DataFrame({'Name':['Depak','John','Jose','Tojo'],
        'Age':[22, 35, 28, 30],'Salary':[15000,25000,18000,20000]})

dataset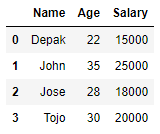
2. Code for Creating a model & doing the prediction.
"""
Reshaping is done to convert 1D data to 2D data because the model accepts only 2D data.

"""
X = np.array(dataset['Age']).reshape(-1, 1)

y = np.array(dataset['Salary']).reshape(-1, 1)

lm = LR() #loading the linear regression model.

lm.fit(X,y) #fitting the model with the variables.

lm.predict(np.array([25]).reshape(-1,1)) #predicting the salary for person aged 25
Output :
salary of a person aged 25 is predicted as 16625.36023055
array([[16625.36023055]])7. Tensorflow 2.0
Tensorflow is one of the most popular Deep Learning frameworks widely used for training and developing neural network models. It offers a high-level programming interface to do these tasks. And Tensorflow 2.0 is an update to this framework. One of the most important additions in this update is Keras, which is a high-level deep learning API developed by Google. As a result model building is much easier than before. And because of these reasons learning Tensorflow 2.0 can be a big addition to your Data Science armory.
Uses
Listed below are some of the uses of this library.
- Image Recognition.
- Voice Recognition.
- Video Detection.
- Text Analysis.
Installation
For the python environment use the following code.
pip install tensorflowFor the conda environment use the following code.
conda install -c conda-forge tensorflowVisit the official Tensorflow website to know more.
8. NLTK
NLTK is a python package that is used for Natural Language Processing. It stands for Natural Language Toolkit. As the name suggests, the library contains tools that can be used to perform NLP. Learn more about NLP here.
Features
Some of the features provided by the library are as follows:
- Tokenizing
- Filtering Stop Words
- Stemming
- Tagging Parts of Speech
- Lemmatizing
- Chunking
- Chinking
- Named Entity Recognition
All these features mentioned above make NLTK a powerful tool to know.
Installation
For the python environment use the following code.
pip install nltkFor the conda environment use the following code.
conda install -c anaconda nltkVisit the official NLTK website to know more.
9. Beautiful Soup
Getting information from web pages, often known as web scrapping is an important Data Science task. Beautifulsoup is a library that does this function. You might have wondered why it is called “beautiful soup”. This is because it converts the poorly-formed stuff on the web referred to as “tag soup” to a more understandable or usable form.
Installation
For the python environment use the following code.
pip install beautifulsoup4For the conda environment use the following code.
conda install -c anaconda beautifulsoup4Visit the official BeatifulSoup website to know more.
10. OpenCV
OpenCV is an open-source library used for image or video processing. After processing the images the library can be used to detect objects, human faces or handwriting, etc. As a result, it is a powerful tool for computer vision and artificial intelligence applications.
Applications
Some of the applications of OpenCV are listed below.
- Face detection.
- Face Recognition.
- Object detection.
- Automated inspection and surveillance.
- Medical image analysis.
- Driverless car navigation and control.
- Robots
Installation
For the python environment use the following code.
pip install opencv-pythonFor the conda environment use the following code.
conda install -c conda-forge opencv11. Face Recognition
Bult using dlib‘s state-of-the-art face recognition package, the Face Recognition library has an accuracy of 99.38 in benchmark tests. Which is more than enough for many computer vision applications. It also comes with a simple face_recogntion command-line tool that lets you do face recognition easily from the command line. We would see some of the applications of this library below.
Applications
- Finding faces in pictures.
- Manipulate the facial features in the pictures that we have found.
- Give an identity to these faces.
Installation
For the python environment in mac or Linux use the following code.
pip3 install face_recognition
For installing this library on windows use the following tutorial.
Windows Installation Tutorial · Issue #175 · ageitgey/face_recognition (github.com)
Hope you got an idea about Python Libraries for Data Science.
Thanks for reading!
After learning all these libraries you would most definitely be ready to take on amazing Data Science problems and projects. But don’t stop your learning here. Because the world of Data Science is vast and there is way more for you to learn. And please make sure you practice what you have learned. Because only by practice you can actually master anything. And after that apply that knowledge to solving real-life problems.
I hope you have enjoyed the article and in order to keep up with new articles visit the website.
Now take this self assessment test related to this article.

Now or Never
We’ve got your back on your manufacturing journey — Stay in touch
Follow us for step-by-step guidance, templates, and insights that save time and reduce mistakes.
Know Industrial Engineering Platform – Helping manufacturing industry professionals worldwide since 2019

Very useful article, especially for beginners in python
Thank you Meet