In this article we are discussing some of the most important statistical concepts that you should know, if you have decided to go ahead with data science. We use these concepts in data science, for analyzing the data, getting insights from it, and using those insights to create a model that would solve our problem. This article ‘Statistics for data science – Descriptive Statistics’, will be helpful to beginners.
Take a look at our article on introduction to Data Science for getting a better understanding of Data Science and also check out our other Data Science articles for understanding the major tools you should be familiar with for becoming a Data Scientist.
Lets discuss each concepts one by one….
The two main branches of statistics are Descriptive statistics and Inferential statistics.
Let’s discuss descriptive statistics first.
But, before that we must know the most important terms in statistics, Population and Sample.
Learn about the providers of online masters in data science by clicking here
Population


See how Factovare helps factories digitize work
Watch the demo and contact us to try Factovare for your manufacturing operations.
FCMEP Three-Month Programme Registration
Factovare Certified Manufacturing Excellence Professional (FCMEP)
Trainer: Founder of Factovare and Know Industrial Engineering
Learn directly from the person behind both platforms.
Foundation session
Any one Tuesday · 1 hour
Trainer: Founder of Know Industrial Engineering and Factovare.
Doubt clearance
Alternate Thursdays · 09:00 PM IST · 1 hour
Trainer: Founder of Know Industrial Engineering and Factovare. Attend every eligible session during your active period.
Self-learning access
Three months of guided practice
Use selected Factovare modules and protected training materials to learn and practise throughout the programme.
You may attend any one Tuesday foundation session. Your three-month programme starts on the date you attend your first foundation session. From that date, you can self-learn using the training materials and eligible Factovare modules, and attend all eligible alternate-Thursday doubt-clearance sessions.
What you will learn
Enter your details, verify your email and complete the one-time $29 USD payment to join the three-month programme.
Step 1: Enter your name and email address, then click Send OTP.
A Population is a group of values of anything, which is under statistical study. A population can be a list of heights of whole people of a country, list of weights of all products produced in a shift in a factory, list of marks of whole students in a school, list of values obtained after continuously tossing a coin for some time, etc.
I think now you got an idea of Population.
Sample
A sample is a subset of population, which contain values that are collected through sampling techniques from population. List of heights of 100 peoples from a country, list of weight 10 products sampled from a 1000 products produced in a factory, etc. are examples of sample.
In descriptive statistics we analyze the sample data and in inferential statistics we will try to relate the results of sample data analysis, to the population.
Descriptive Statistics
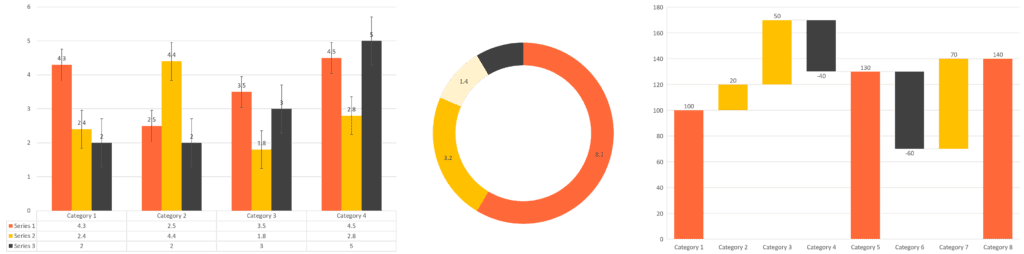
In descriptive statistics, we use certain mathematical tools to describe the data in the form of numbers or graphs, or tables. For example, if we give a statistician a set of data about the patient’s detail of a hospital, and tell him to find out interesting information from it, then what he needs to do is descriptive statistics. He would learn about the data and come up with interesting information that he derived from the data. The results of this would be information like 50% of the patients has shown certain symptoms, out of 180 patients 70 of them had spent more than a week in the hospital, etc.
Following are some of the important concepts in descriptive statistics which will help to extract required information from the sample data and let’s discuss each in detail
- The measure of Central Tendency
- Measure of Spread
- Covariance & Correlation
1. The measure of Central Tendency
The measure of central tendency is a value that helps us identify the central position of the data.
Mean
Mean or the average of a set of numbers is the result of summing up all the values in a dataset and dividing it by the total number of values. Taking the mean of a dataset would help us to understand the performance of a system in general. For example, the average of a batsman in cricket can be used to understand how well his performance is. If he often scores more 100s than 0s then his average would be getting higher and higher. Also, it can be used to calculate the popularity of a product by taking the average buys in a season or a region.
The formula for calculating the mean is simple:
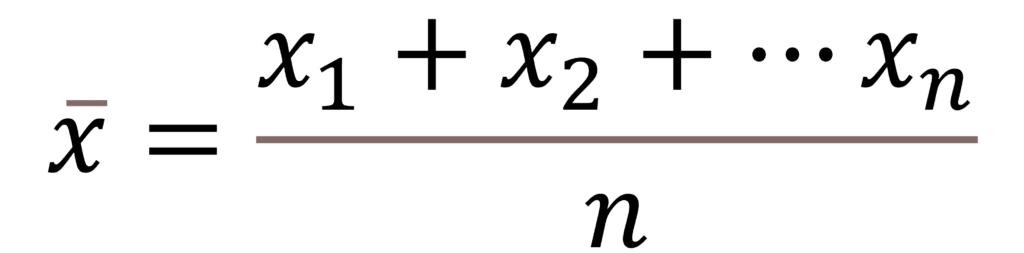
Here x1, x2, etc are the values in the data set and n is the no of values in the data set.
One problem about mean is that it is susceptible to outliers. Now if we take the example of averages in cricket, if a batsman has played just 10 matches and in 3 of them, he has scored 200 runs and in the rest 7 he goes out for 0 his average would still be (3*200)/10 = 60. We can’t conclude from this that he scores around 60 in every match he plays.
Median
Median solves the problem of outliers as it picks the central most value of the set of values when it is arranged in ascending order. In this case, even if there are big data points towards the end of the dataset it won’t affect the median value. It would help us to understand the consistency of a particular range of values in a dataset.
The formula for calculating median:
Before applying this formula, sort the values in data set in ascending order.
For a dataset with an odd number of values the median = (n+1)/2 th value
n = no of values in the data set.
For a dataset with an even number of values the median =
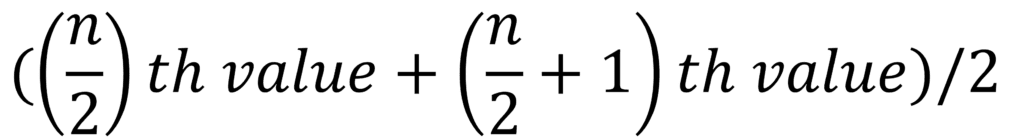
n = no of values in the data set.
Mode
The mode of a set of data values is defined as the most frequently occurring value in that set of data values. It can be useful in finding out the most popular product or the most popular movie among a set of products or movies. Also, it can be used to find out the most common height or weight of the population in a region, etc.
2. Measure of Spread
Range
Range is the difference between the largest and the smallest value in a dataset. This gives us an idea about the spread of the data. For example if we have data set of dimension if hole, 2.3, 4.5, 6.7, 8.9, 6.7, then we can say that the range of this data set is 6.6.
Inter Quartile Range (IQR)
IQR is an another measure which will be helpful to know the spread of the data set, which will eliminate the effect of outliers.
As a first step for calculating IQR, the entire data set is to be arranged in ascending order. Then the data set is divided into 4 parts by 3 points called quartiles, Q1, Q2 and Q3.
- Q1 is the median value in the first half of the set.
- Q2 is the median value in the whole set.
- Q3 is the median value in the second half of the set.
Example: Consider the set of numbers {1,2,3,4,5,6,7,8}
Q1 = (2+3)/2 = 2.5
Q2 = (4+5)/2 = 4.5
Q3 = (6+7)/2 = 6.5
IQR = Q3-Q1 = 6.5-2.5 = 4.
Higher the IQR, higher the spread and vice versa. Also, the effect of outliers in calculating range is reduced in calculating IQR.
Variance
It shows the average square of the difference between a data point and the mean of the data. The formula for variance of population is shown below.
Formulae for calculating variance =

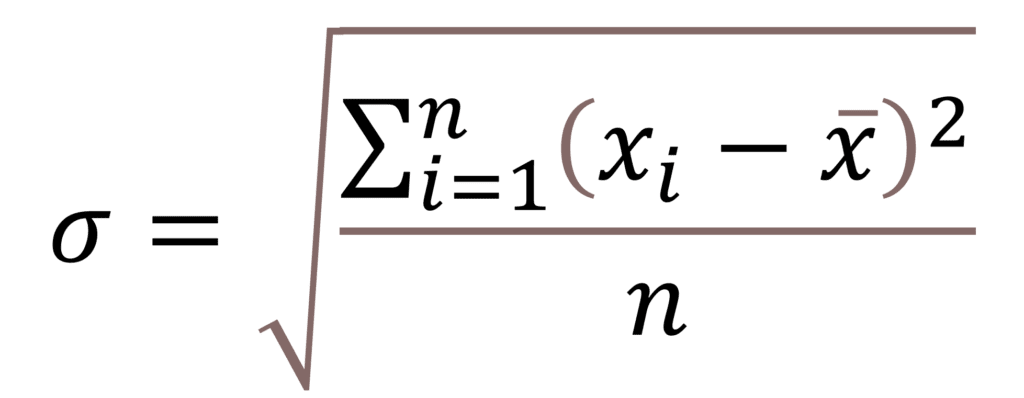
Standard Deviation
It is another way of knowing the average difference between a data point and the mean of its distribution. It’s calculated as the root of variance.
The advantage of standard deviation over variance is that the standard deviation is in the same unit as that of mean, so it makes comparison easier.
For example, I’m measuring the height of 100 people and the average height I got is 1.7 meters and its standard deviation is 0.2 meters. It gives me an idea of the distribution of heights among those 100 people.
But if I calculate the variance of the distribution and got a value of 0.04 square meters, there is nothing much we can do with that data.
Formulae:
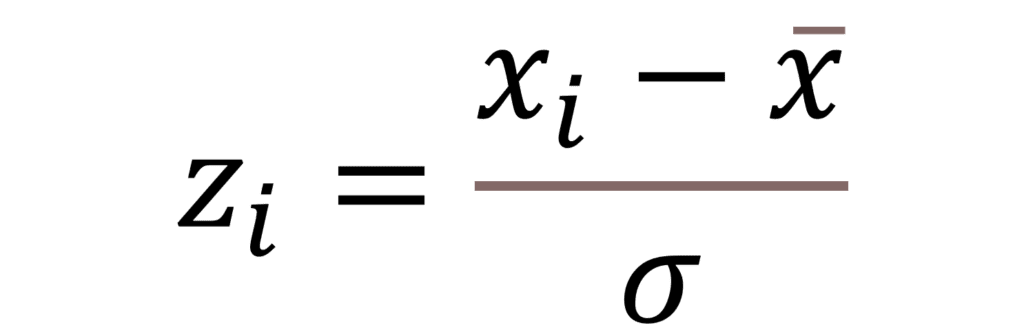
Z-Score
It measures how many standard deviations from the mean a particular data point is in the distribution.
Formulae:
3. Covariance & Correlation
Covariance & Correlation are two mathematical concepts used to determine the relationship between two random variables.
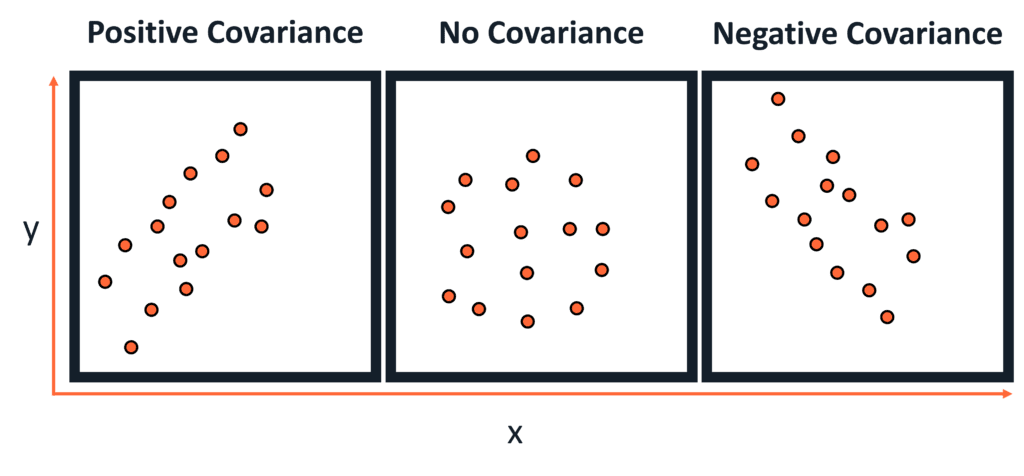
Covariance
- It is the linear relationship between a pair of random variables (x & y) where a change in one variable causes a change in another variable.
- It can take values between -infinity to +infinity. Here the negative value represents a negative relationship and the positive value represents a positive relationship between the random variables.
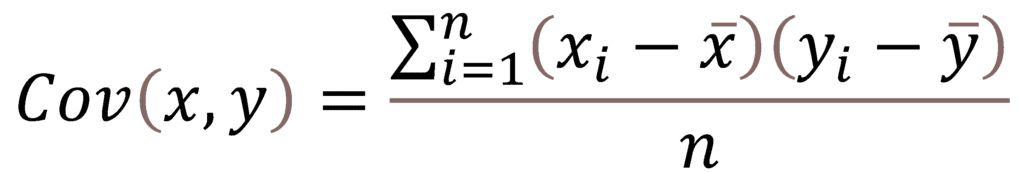
Formulae (For population):
Formulae (For sample):
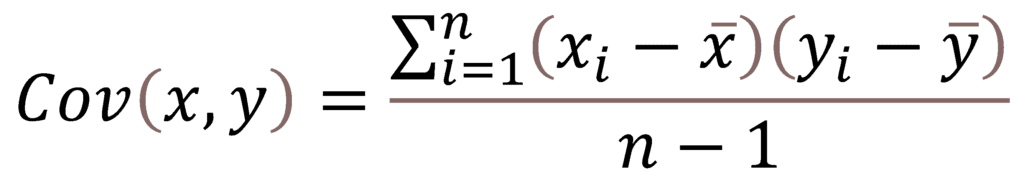
Here:
x-bar and y-bar are the means of the values taken by the two random variables x and y.
n = total no of values.
xi and yi are individual values in the dataset.
Example –
Correlation
- It shows how strongly the random variables are related to each other.
- Correlation takes values between -1 to +1. Here a value close to +1 represents strong positive correlation and a value close to -1 represents strong negative correlation between the random variables.
- It gives the strength of the relationship between variables.
Formulae –
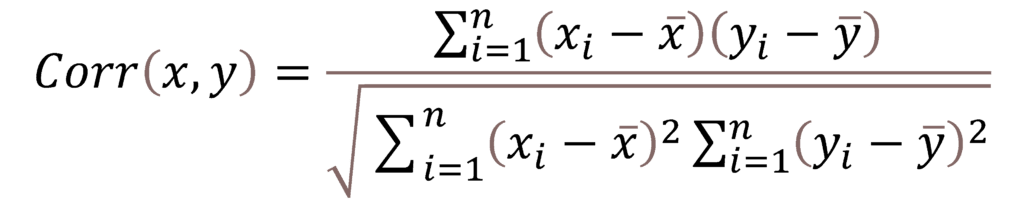
Here:
x-bar and y-bar are the means of the values taken by the two random variables x and y.
n = total no of values.
xi and yi are individual values in the dataset.
Example –

- Covariance is the measure of variation of two random variables.
- Correlation is the measure of strength of the relation between two random variables.
That’s all for now….
We shall discuss inferential statistics in another article.
Till then bye….
If you know any tiny subject that can be related to manufacturing industry or industrial engineering, you can earn some income by becoming article contributor of this website. For knowing more about it, please visit Join us page.
You don’t need to have any experience in article writing, just knowledge on the subject is needed.
Also you can know more about our team of article contributors by visiting the about us page.
About the Author

Deepak Jose is a B-Tech CS student with a passion for Data Science. Loves learning about Data Science, coding, and science in general. Does data analysis and visualization as a hobby. Even though I’m in the Computer Science path I always find time to learn about space, automobiles, geography, energy, architecture, arts, etc. Loves solving problems and learning about new inventions.
Now or Never
We’ve got your back on your manufacturing journey — Stay in touch
Follow us for step-by-step guidance, templates, and insights that save time and reduce mistakes.
Know Industrial Engineering Platform – Helping manufacturing industry professionals worldwide since 2019
